NetVis is a package for interactive visualization of Python NetworkX graphs within JupyterLab. It leverages D3.js for dynamic rendering and provides a high-level Plotter API for effortless network analysis.
Version 0.5.0 introduces the NetworkX Plotter API, enabling direct visualization of NetworkX graph objects without manual JSON conversion.
You can install using pip:
pip install net_visThis provides core functionality with layouts: spring, circular, and random.
For all layout algorithms including kamada_kawai and spectral:
pip install net_vis[full]This installs optional dependencies (scipy) required for advanced layout algorithms.
Note: NetVis uses a MIME renderer that works automatically in JupyterLab 3.x and 4.x environments. No manual extension enabling is required.
The easiest way to visualize NetworkX graphs in JupyterLab:
from net_vis import Plotter
import networkx as nx

# Create a NetworkX graph
G = nx.karate_club_graph()

# Visualize with one line
plotter = Plotter(title="Karate Club Network")
plotter.add_networkx(G)Control node colors, labels, and layouts:
# Color nodes by attribute, customize labels
plotter = Plotter(title="Styled Network")
plotter.add_networkx(
    G,
    node_color="club",              # Use 'club' attribute for colors
    node_label=lambda d: f"Node {d.get('name', '')}",  # Custom labels
    edge_label="weight",            # Show edge weights
    layout='kamada_kawai'           # Choose layout algorithm
)- Graph Types: Graph, DiGraph, MultiGraph, MultiDiGraph
- Layouts: spring (default), kamada_kawai, spectral, circular, random, or custom functions
- Styling: Attribute-based or function-based color/label mapping
- Automatic: Node/edge attribute preservation in metadata
For manual control over the visualization data structure:
import net_vis
data = """
{
"nodes": [
{
"id": "Network"
},
{
"id": "Graph"
}
],
"links": [
{
"source": "Network",
"target": "Graph"
}
]
}
"""
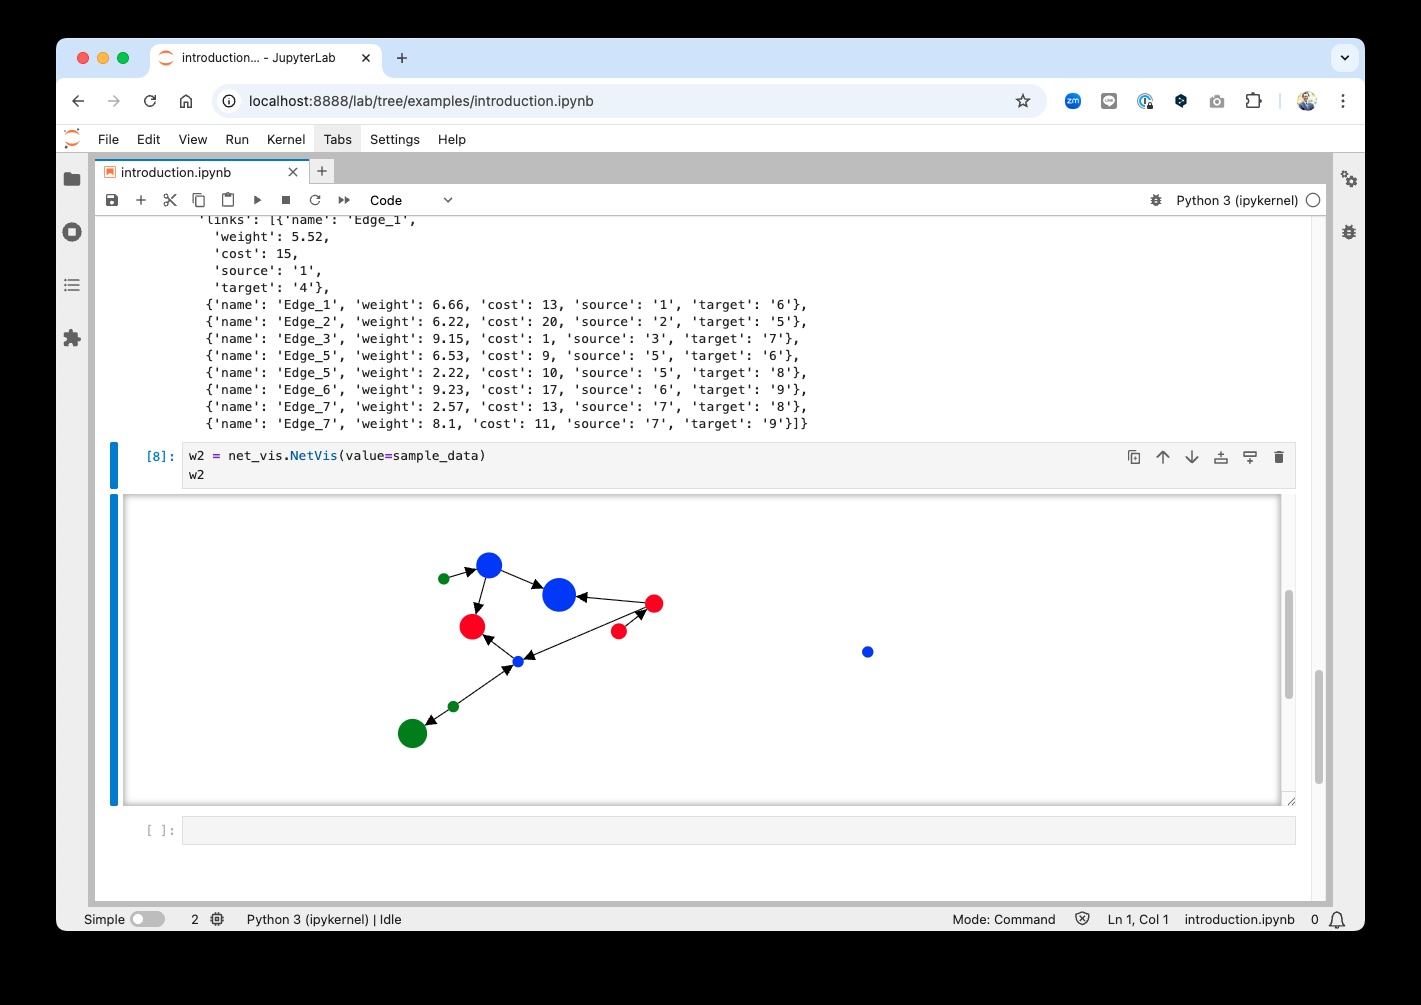
w = net_vis.NetVis(value=data)
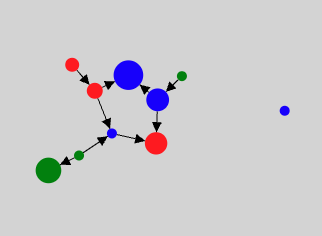
wWhen executed, an interactive D3.js force-directed graph is displayed.
- Display Sample
Create a dev environment:
python -m venv venv-netvis
source venv-netvis/bin/activate
Install the Python package. This will also build the TypeScript package:
pip install -e ".[test, examples, docs]"Install JavaScript dependencies and build the extension:
yarn install
jupyter labextension develop --overwrite .
yarn run buildNote: As of version 0.4.0, nbextension support has been removed. NetVis now exclusively uses the MIME renderer architecture for JupyterLab 3.x and 4.x.
If you use JupyterLab to develop, you can watch the source directory and run JupyterLab at the same time in different terminals to watch for changes in the extension's source and automatically rebuild the extension.
# Watch the source directory in one terminal, automatically rebuilding when needed
yarn run watch
# Run JupyterLab in another terminal
jupyter lab
After a change, wait for the build to finish and then refresh your browser and the changes should take effect.
If you make a change to the Python code, you will need to restart the notebook kernel to have it take effect.
Contributions are welcome!
For details on how to contribute, please refer to CONTRIBUTING.md.
This project was initiated on the proposal of Shingo Tsuji. His invaluable contributions —from conceptual planning to requirements definition— have been instrumental in bringing this project to fruition. We extend our deepest gratitude for his vision and support.