Statistics
There are different statistics graphical views.
- Descriptive Statistics
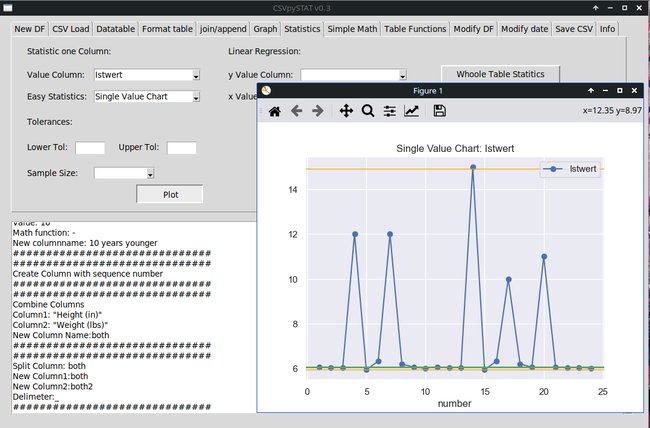
- Single Value Chart
- Xbar/s Chart
- Capability Analysis
- Histogram
- QQ-Plot
- Test of normal distribution
- Outlier Test
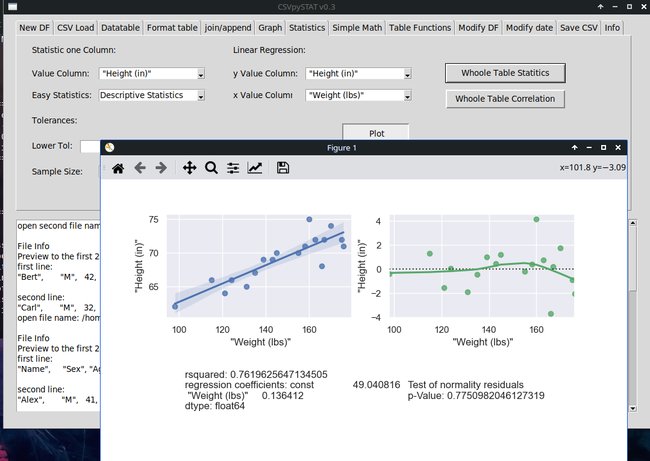
- Linear Regression Analyze
There are different statistics graphical views.