How to investigate slowness with PerfView
The article shows how to figure out where the delay is coming from.
We'll try to understand the nature of the Experience Editor opening speed and potential steps to improve it.
The game plan is:
- Record the video showing what are threads doing
- Find the
slowoperation in the video - Figure out what makes it slow
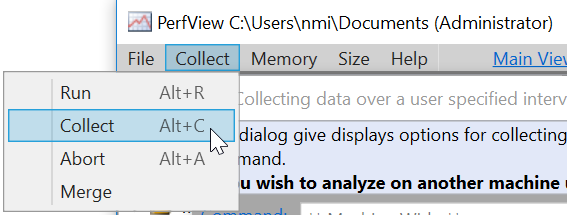
We'll use the free PerfView developed by Microsoft performance architects- just 2 clicks to collect the needed data:
Important to select Thread Time:
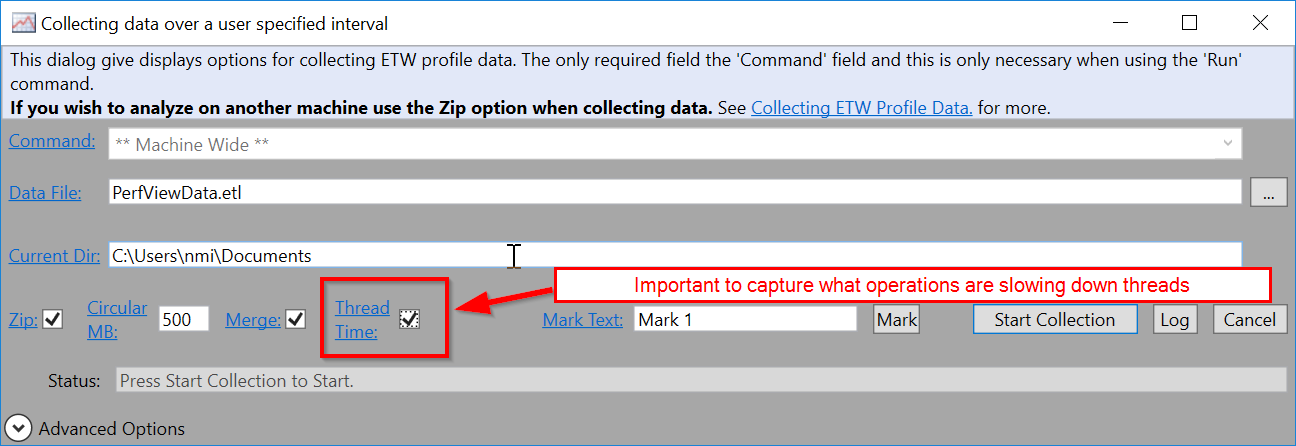
Once you push Start Collection data needed in 98% cases is already picked.
- The closer profiling session matches the
slowoperation start, the more useful information you have. - A few 2 long profiles are far better than one hour long
Please do NOT collect profiles longer than a few minutes.
In the demo we are interested to investigate what affects Experience Editor opening performance, thus the preparation step would be to login to Sitecore.
- Start the collection
- Request Experience Editor page
- Stop collection after page fully loaded
Please refer to the video for more details.
The definitive description of the steps from How to analyze the PerfView profile with thread time data video:
- Advanced group already ships with a cooked report
Thread Time (with Tasks) Stacks- just open it - Add the values to the
IncPatstextbox to filter out tons of non-needed data:-
Sitecoreto only include frames having smth to do with our application -
System.Webto only include frames dealing with Web operation. This shall filter out FileWatchers and background operations
-
- Find the heaviest thread by ordering frames
Inccolumn and adding it toIncPatsfilter - Hiding the noise done by fast operations by setting
Foldingto a few % - There are well-known empty methods that do not cause any load and can be
Foldedto simplify the graph:- CorePipeline.Run -> just invoke processors one-by-one
- dynamicClass -> Sitecore Reflection feature allowing fastest method call
- Swithcing to the
Flame graphview we can hover over bars to find what slows us down