Metrics
The following metrics are measured. The tool is modular and other custom metrics can be added.
[Work in progress, filling this up now]
These metrics are obtained from the Chrome Developer Tools timeline. They are the same metrics you see in the timeline when a web page is profiled.

| Name | Unit | Description |
|---|---|---|
| CompositeLayers | ms | The time spent compositing rendering layers into a screen image |
| DecodeImage | ms | The time spent decoding images |
| EvaluateScript | ms | The time spent evaluating the page's scripts |
| EventDispatch | ms | The time spent executing event handlers |
| FireAnimationFrame | ms | The time spent handling scheduled animation frame events |
| FunctionCall | ms | The time spent executing calls to top-level Javascript functions |
| GCEvent | ms | The time spent doing garbage collection during script execution |
| Layout | ms | The time spent on (re)flow, or constructing the rendering tree from the DOM tree |
| Paint | ms | The time spent rasterizing the page into bitmaps |
| PaintSetup | ms | The time spent converting DOM elements into a display list of drawing commands to paint |
| ParseHTML | ms | The time spent executing the engine's HTML parsing algorithm |
| Program | ms | The total time for all actions to render the page |
| RecalculateStyles | ms | The time spent recalculating element styling, when a reflow occurs |
| TimerFire | ms | The time spent executing timer-triggered handlers |
| XHRReadyStateChange | ms | The time spent handling handling changes to the ready state of XMLHTTPRequest's |
| Name | Unit |
|---|---|
| droppedFrameCount | count |
| numFramesSentToScreen | count |
| numAnimationFrames | count |
| Name | Unit |
|---|---|
| Layers | count |
| PaintedArea_total | sq pixels |
| PaintedArea_avg | sq pixels |
| NodePerLayout_avg | count |
| ExpensivePaints | count |
| GCInsideAnimation | count |
| ExpensiveEventHandlers count |
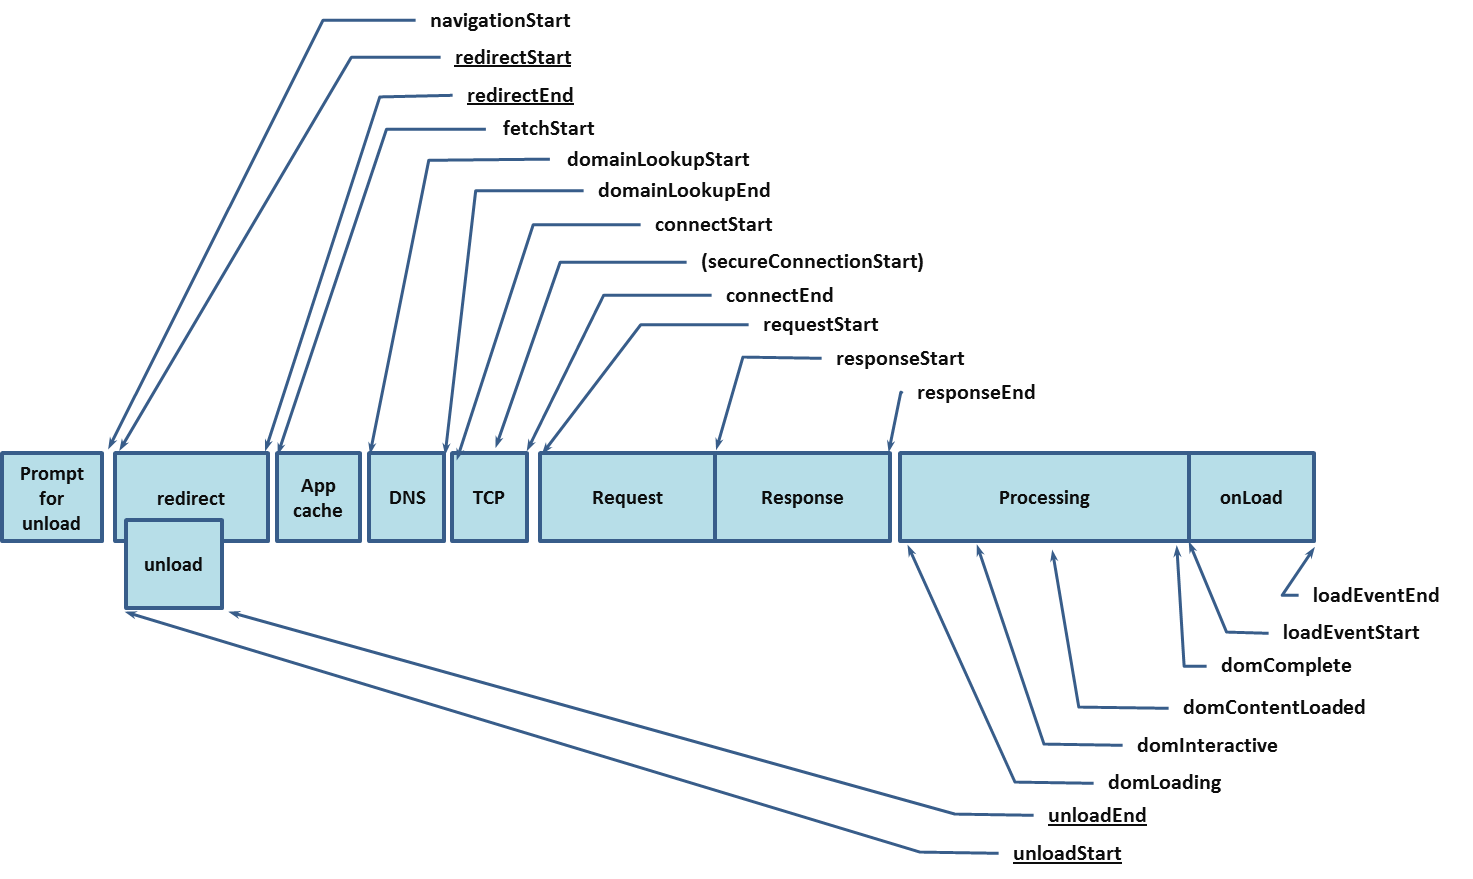
These are calculated from window.performance.timing API in NavTimingMetrics. For more information about each metric, please the W3C Specification
Each of these numbers in the metrics indicate the time elapsed after the previous event.
The order of the event flow is
| Name | Unit | Description |
|---|---|---|
| connectStart | ms | The time immediately before the user agent started establishing the connection to the server to retrieve the document |
| connectEnd | ms | The time immediately after the user agent finished establishing the connection to the server to retrieve the document |
| domComplete | ms | The time immediately before the user agent set the document's readiness to complete |
| domContentLoadedEventStart | ms | The time immediately before the user agent fired the DOMContentLoaded event |
| domContentLoadedEventEnd | ms | The time immediately after the document's DOMContentLoaded event completed |
| domInteractive | ms | The time immidiately before the user agent set the document's readiness to interactive |
| domLoading | ms | The time immidiately before the user agent set the document's readiness to loading |
| domainLookupStart | ms | The time immediately before the user agent started the domain name lookup for the document |
| domainLookupEnd | ms | The time immidiately after the user agent finishes the domain name lookup for the document |
| fetchStart | ms | The time immediately before the user agent checks caches for resources OR starts fetching resources |
| firstPaint | ms | The time immediately before the first paint occurred |
| loadEventStart | ms | The time immediately before the load event was fired for the document |
| loadEventEnd | ms | The time the load event for the document completed |
| requestStart | ms | The time immediately before the user agent started requesting the document from the server |
| responseStart | ms | The time immediately after the user agent received the first byte of the server's response to the document request |